
Key Takeaways
- Japan’s 10-year yield hit 3% for the first time since 1996 as USD/JPY returned to around 160 after the late-July U.S.-Japan intervention faded.
- The old USD/JPY anchor — the U.S.-Japan 10Y yield spread — broke after mid-2025; Japan’s own yield curve, fiscal risk, and term premium are now what drive the currency.
- The Takaichi Trade amplified a shift that had already begun: long-dated JGB yields are increasingly pricing Japan’s fiscal credibility rather than BOJ policy alone.
- September is unusual because both the BOJ and the Fed are facing rate-hike pressure, which can leave the bilateral short-rate gap almost unchanged even after tightening.
- The main September risk for U.S. equities is valuation compression at a higher cost of capital, not a classic yen carry-trade unwind.
September opened with pressure coming from the bond market first. Japan’s 10-year government bond yield reached 3% on September 1, the highest level since 1996, while the 2-year yield rose to 1.81%, a 31-year high. The U.S. 10-year Treasury yield was back near 4.8%, the 30-year remained above 5%, and USD/JPY had returned to around 160 even after a rare joint U.S.-Japan intervention briefly pushed the yen almost 4% higher in late July. Reuters
That is an uncomfortable setup for equities entering what has historically been the weakest month of the year. The so-called “September effect” is a statistical tendency rather than a causal force: the S&P 500 has produced its weakest long-run average monthly return in September, while post-summer positioning, quarter-end rebalancing and a pickup in financing activity can amplify volatility that is already present. The calendar does not create a selloff by itself. What matters this year is that September begins with long-term funding costs in both Japan and the United States already moving higher. MarketWatch
The more important shift is happening in Japan. For years, one of the cleanest ways to explain the yen was the U.S.-Japan yield gap. Since mid-2025, that relationship has weakened sharply. The yen is increasingly being priced not only off what U.S. rates are doing relative to Japan, but also off Japan’s own yield curve, fiscal risk and the premium investors demand to hold long-dated Japanese government debt.
That change is now starting to matter for Treasuries, the dollar and U.S. technology stocks.
The old USD/JPY anchor has weakened
For much of the last several years, USD/JPY followed a straightforward interest-rate logic. When U.S. bond yields rose relative to Japanese yields, dollar assets offered a larger return advantage, capital favored the dollar and USD/JPY tended to move higher. When the gap narrowed, the yen usually strengthened.
That framework was particularly useful during 2022–2024. The Federal Reserve tightened aggressively while the Bank of Japan kept rates extremely low, making the yen one of the world’s cheapest funding currencies. Borrowing yen and holding higher-yielding dollar assets became one of the most crowded global macro trades.
But the relationship began to break down around the middle of 2025. The IMF’s 2026 Japan Article IV report highlights the divergence: after late June 2025, the U.S.-Japan 10-year yield spread narrowed by more than 100 basis points, reaching its smallest level since early 2022, yet the yen continued to weaken. Traditional drivers such as the bilateral yield gap, oil prices and global risk sentiment were no longer enough to explain the currency move. At the same time, the IMF found that term premium and fiscal-risk repricing had become increasingly important in Japan’s long-dated bond market. IMF
The key question therefore changed.
Before mid-2025, investors mostly asked: How much more yield does the United States offer than Japan?
Now they also have to ask: Why are Japanese yields rising in the first place?
That distinction matters because a rise in Japanese yields can support the yen or weaken it, depending on what is driving the move.
Japan’s own yield curve now carries more information than the headline 10-year yield
The 2-year JGB yield is closely tied to expectations for the Bank of Japan’s next few policy decisions. The 10-year yield also incorporates inflation, government bond supply, fiscal credibility and term premium. A rise led by the short end therefore means something very different from a selloff concentrated in the long end.
If the 2-year yield rises quickly because markets expect tighter BOJ policy, Japanese short-term rates become more competitive, the U.S.-Japan short-rate gap narrows and borrowing yen becomes less attractive. That is normally supportive for the currency.
If the 10-year, 20-year and 30-year sectors rise much faster than the front end, investors are demanding a larger premium to hold Japanese government debt for a long time. That can reflect heavier issuance, persistent inflation, fiscal concerns or doubts that monetary tightening is keeping pace with the government’s fiscal stance. In that environment, higher Japanese yields do not automatically mean a stronger yen.
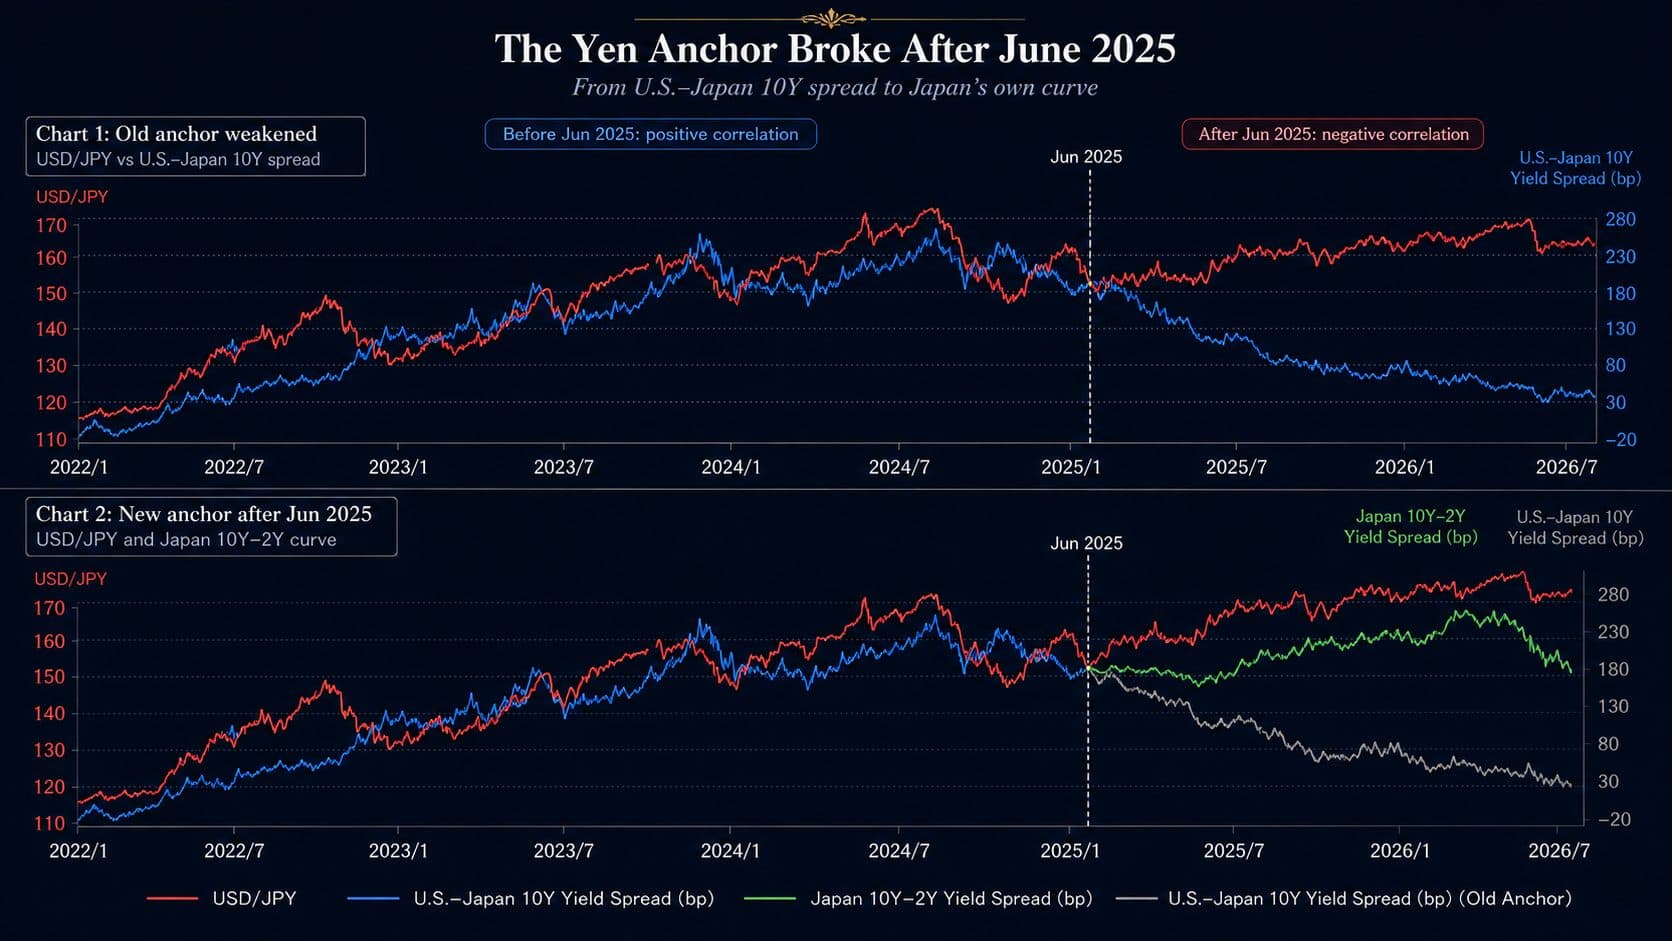
This is what made the steepening of Japan’s 2s10s curve so important over the past year. In July 2026, the gap between the 10-year and 2-year JGB yields widened to roughly 143 basis points, the steepest since 2004. By September 1, the 2-year had caught up to 1.81% while the 10-year reached 3%, narrowing the curve to roughly 119 basis points. The front end is now pricing more BOJ tightening, but the long end is still carrying a substantial fiscal and term-risk premium. Reuters Reuters
That helps explain why a 3% Japanese 10-year yield has not produced a durable yen rally. Investors are being paid more to hold Japanese bonds, but part of that extra yield is compensation for risk rather than a simple improvement in Japan’s rate advantage.
The market is no longer treating every rise in Japanese yields as yen-positive.
The Takaichi trade amplified a shift that had already begun
After Sanae Takaichi won the LDP leadership contest in October 2025, Wall Street traders attached a label to a clear cross-asset setup: the Takaichi Trade. The expression referred to a portfolio positioning pattern rather than a formal policy package — long Japanese equities, short the yen and short long-dated JGBs.
The trade made sense under the policy mix investors expected. More aggressive fiscal support, tax cuts and strategic investment in areas such as semiconductors, AI, defense and energy could lift nominal growth and corporate earnings, supporting Japanese equities. The same spending would also increase financing needs, government bond supply and inflation risk, putting upward pressure on long-term JGB yields. If the BOJ tightened only gradually, the yen could remain an attractive funding currency.
That is largely how the first phase traded. Japanese equities surged, the yen weakened and long-dated JGB yields moved higher. Reuters
The sequencing matters. The yen had already started to decouple from the traditional U.S.-Japan yield-spread relationship before Takaichi took office. Her more aggressive fiscal agenda did not create that break; it amplified the market’s willingness to price fiscal risk directly into Japan’s long end.
Since then, the fiscal constraint has become harder to ignore. Japan’s Ministry of Finance has projected record debt-servicing costs for fiscal 2027, while the assumed interest rate used in budget calculations has risen materially. With gross public debt still above 200% of GDP, the long end of the JGB curve has become one of the clearest market prices for Japan’s fiscal credibility. Reuters
This also changes the equity side of the trade. A weak yen still boosts the translated overseas earnings of exporters, and fiscal investment still supports selected industries. But higher long-term yields raise financing costs and compress valuations, while faster BOJ tightening would reduce the currency tailwind exporters have enjoyed. The early combination of “stocks up, yen down, bonds down” has become much less one-directional.
Why did the United States step in to support the yen?
By late July, the pressure had become large enough to trigger an unusual policy response. USD/JPY had moved close to 164, and the United States joined Japan in supporting the yen.
On July 31, U.S. and Japanese authorities carried out a rare coordinated intervention. The U.S. side used an unusual route — selling euros and buying yen rather than simply selling dollars. That allowed Washington to support the yen while reducing the risk that the operation would be interpreted as a broad U.S. policy to weaken the dollar, which would have been awkward while U.S. inflation was still above target. Japan Ministry of Finance Reuters
The move worked briefly. The yen gained almost 4% in a week, its strongest weekly advance in roughly two years. But the support faded. Japan later disclosed that it had spent 15.4 trillion yen, about $96.5 billion, on currency intervention between July 30 and August 26, yet USD/JPY was again near 160 by the start of September. Reuters
That short-lived response is important. Currency intervention can change positioning and punish speculative shorts, but it cannot permanently overpower a large rate gap, persistent fiscal concerns and a market that still sees the yen as a cheap funding currency.
The FIMA Repo Facility matters for the same reason.
Japan has indicated that it may use the Federal Reserve’s FIMA Repo facility, which allows foreign official institutions to obtain dollar liquidity against eligible Treasury securities without first selling those securities outright. This matters because Japan is one of the largest holders of U.S. government debt. If it needs more dollars to support the yen, Washington has an obvious interest in making sure those dollars can be obtained without adding unnecessary selling pressure to the Treasury market. Japan Ministry of Finance
The U.S. is not trying to set Japanese interest rates. It is trying to keep Japan’s currency adjustment from becoming an additional source of instability in the world’s most important government bond market.
Japan does not need to dump Treasuries to matter for Treasury yields
Japan held roughly $1.116 trillion of U.S. Treasuries at the end of June 2026, keeping it among the largest foreign holders. Its holdings fell during June, although that decline alone does not prove the bonds were sold to finance FX intervention. Reuters
The more important effect is likely to be slower and less dramatic.
Japan’s 10-year yield is now around 3%, while the U.S. 10-year is near 4.8%. The headline long-term yield advantage of Treasuries is therefore only about 1.8 percentage points. Japanese insurers, banks and pension funds that buy Treasuries and hedge the dollar exposure also face hedging costs linked to the much wider short-term U.S.-Japan rate gap.
The exact hedged return depends on tenor, cross-currency basis, hedge ratio and liability structure, so there is no single number that applies to every institution. But the direction is clear: a 3% domestic JGB is far more competitive than a 0%–1% JGB was. The extra yield offered by Treasuries is no longer automatically enough to justify the currency, hedging and liquidity risk.
Japan therefore does not need to “dump” $1 trillion of Treasuries to affect the market. If insurers put more new money into JGBs, if pensions rebalance slightly toward domestic bonds, or if maturing Treasury positions are rolled over at a slower pace, U.S. government debt loses an important marginal buyer.
The IMF has also found that shocks in JGB yields spill into overseas sovereign bond markets, with larger effects where Japanese investors have a stronger presence. IMF
This matters more because the United States has its own supply problem. Public debt is above $40 trillion, fiscal deficits remain large, and AI infrastructure spending has pushed major technology companies into the bond market at the same time the government is issuing huge volumes of debt. Fed Chair Kevin Warsh has described the global backdrop as a shift from a “savings glut” toward an investment boom, with governments, AI, energy, defense and infrastructure all competing for long-term capital. Reuters
Japan is not the reason U.S. yields are high. It is becoming a more important marginal factor at precisely the moment when the United States needs more long-term capital, not less.
September is unusual because both the BOJ and the Fed are facing rate-hike pressure
The next layer of the problem is that September is not just about the long end of the curve.
A late-August Reuters poll found that 57% of economists expected the BOJ to raise its policy rate from 1% to 1.25% in September, up sharply from just 5% in the prior month’s survey. The drivers are familiar: a weak yen, higher import costs and inflation that is still difficult to contain. Reuters
At the same time, the Fed has moved back into the rate-hike conversation. Higher energy prices, renewed inflation concerns and Warsh’s hawkish Jackson Hole message pushed the market-implied probability of a September Fed hike toward roughly two-thirds by the start of the month. Reuters
This creates a particularly awkward setup for the yen.
BOJ tightening is supposed to help the currency by raising Japanese short-term rates and narrowing the U.S.-Japan front-end gap. But if the Fed raises rates at the same time, part of that narrowing disappears. A 25-basis-point BOJ hike and a 25-basis-point Fed hike leave the bilateral short-rate gap almost unchanged.
That means Japan may tighten policy and still receive less currency support than it would under a stable or easing Fed.
More importantly, neither central bank directly solves the long-end problem. The BOJ can raise short rates, but that does not automatically remove Japan’s fiscal term premium. The Fed can raise short rates, but that does not solve U.S. Treasury supply, deficits or long-duration inflation risk. September could therefore produce one of the least equity-friendly curve configurations: higher policy rates at the front end while 10-year and 30-year yields remain stubbornly high because fiscal and term premiums do not fall.
A stronger yen would not necessarily mean a weaker dollar
USD/JPY is a bilateral exchange rate, not the dollar itself.
If the BOJ tightens faster than expected, the yen can strengthen against the dollar while the dollar remains firm against the euro, sterling and other currencies. The U.S. can still attract capital through high interest rates and safe-haven demand even if Japan closes part of the bilateral rate gap.
September 1 already showed part of that tension: BOJ tightening expectations were elevated, yet the dollar index remained firm and USD/JPY stayed near 160. Reuters
For U.S. equities, that combination is not especially favorable. A strong dollar reduces the translated value of foreign earnings for multinational companies, while high Treasury yields raise the discount rate applied to future cash flows.
Technology stocks feel both sides of that pressure.
The main September risk is valuation compression, not a carry-trade crash
The most useful distinction now is between a slow rise in global capital costs and a sudden yen-funded deleveraging event.
If the market were already in a classic yen carry unwind, the expected pattern would be a rapidly strengthening yen, forced selling across equities and high-beta assets, and safe-haven buying of U.S. Treasuries that pushes Treasury yields lower. That is close to what happened in August 2024.
The September 2026 setup looks different.
JGBs are selling off. Treasuries are also selling off. The yen remains weak. The dollar remains firm. Investors are demanding a higher return to hold duration rather than rushing into long government bonds for safety.
That makes a rate-driven equity valuation correction the more important base case.
A U.S. 10-year yield near 4.8% and a 30-year yield above 5% already raise the opportunity cost of owning expensive growth stocks. When investors can earn close to 5% on U.S. government debt without taking business risk, companies trading at 30 or 40 times forward earnings need faster and more durable cash-flow growth to justify the same multiple.
AI demand can therefore remain strong while AI stocks fall.
That is exactly what the July correction began to show. The market is no longer asking only whether AI demand exists. It is asking whether the cash flows generated by that demand can outrun a much higher cost of capital.
For companies such as $NVDA, $META, $GOOG and $AMZN, and for the Nasdaq more broadly, the September setup is less favorable than it was in August. My base case is not a systemic crash. It is that the probability of high-level consolidation or a roughly 5%–10% valuation-driven correction is materially higher than the probability of another easy month of multiple expansion.
Credit markets are the main reason not to escalate that conclusion into a crash call. As of September 1, U.S. high-yield spreads remained around 260 basis points and the VIX was near 16. Funding markets were not signaling a broad corporate credit crisis. The bond market is repricing the cost of money, but it is not yet pricing a breakdown in the corporate financing system.
The most important September signal is whether Japan’s new pricing regime persists
The September effect is not the real story.
The more important development is that the yen’s old pricing anchor has weakened. For years, the U.S.-Japan yield gap provided a relatively clean framework for understanding USD/JPY. Since mid-2025, Japanese fiscal risk and the shape of the JGB curve have become much more important.
That changes what investors should watch.
If Japan’s 2-year yield continues to catch up with the 10-year, the market is pricing a more forceful BOJ response. If long-dated JGB yields continue to make new highs while the yen remains weak near 160, the fiscal and term-premium problem has not been resolved. Weekly Japanese data on purchases and sales of foreign bonds will then show whether the shift in domestic yields is actually changing overseas asset allocation.
The U.S. side of the chain is equally important. If Japanese investors reduce foreign bond purchases at the same time that U.S. deficits, Treasury supply, energy inflation and Fed tightening keep the U.S. 10-year near or above 5%, technology stocks will face a higher discount rate for more than a few trading sessions.
Gold and Bitcoin are secondary indicators in this framework. Gold can benefit from fiscal-credit concerns and fears over long-term purchasing power, but rising real yields increase the opportunity cost of holding a non-yielding asset. Bitcoin has a long-run scarcity narrative, but in a sudden yen carry unwind it is more likely to trade like a high-beta liquidity asset and fall alongside technology stocks than behave like a Treasury-style safe haven.
The key assets remain JGBs, USD/JPY, Japanese cross-border bond flows and U.S. Treasuries.
Japan is now affecting the global market through two different channels at once. Higher domestic yields reduce the need for Japanese institutions to search overseas for yield, while persistent fiscal risk can keep the yen weak even as BOJ tightening expectations rise. The first channel can reduce marginal demand for Treasuries; the second keeps pressure on Japan to tighten or intervene.
Both ultimately feed into the global price of capital.
That is why the main September question is not whether a seasonal “curse” will repeat. It is whether the simultaneous repricing of Japanese and U.S. government debt can stabilize before it forces another reset in equity valuations.
Right now, the bond market is sending a clearer warning than the equity market.
This article is for market research and risk-management purposes only and is not investment advice. Market prices and policy expectations are based on information available as of September 1, 2026 and can change quickly.
Sources
| No. | Source | Publisher | Date | Type | What it supports |
|---|---|---|---|---|---|
| 1 | Japan’s benchmark bond yield rises to 3% for first time in 30 years | Reuters | 2026-09-01 | News | JGB 10Y at 3% (highest since 1996), 2Y at 1.81% (31-year high), U.S. 10Y near 4.8%, USD/JPY around 160. |
| 2 | The S&P 500 usually falls in September. Why this year should be different | MarketWatch | n.d. | News | Long-run September return profile for U.S. equities and the seasonality/positioning argument. |
| 3 | Japan: 2026 Article IV Consultation | International Monetary Fund | 2026 | Research | U.S.-Japan 10Y spread break after late June 2025, term-premium and fiscal-risk repricing, and spillovers from JGB yield shocks to overseas sovereign bond markets. |
| 4 | Japan bond market signals waning faith in inflation, government’s fiscal management | Reuters | 2026-07-09 | News | Japan 2s10s curve widening to roughly 143 bp in July 2026, the steepest since 2004. |
| 5 | Japan’s Nikkei surges to record after election win by fiscal dove Takaichi | Reuters | 2025-10-06 | News | First phase of the Takaichi Trade: Japanese equities up, yen weak, long-dated JGB yields higher. |
| 6 | Japan aims to cap FY27 new bond issuance at 40 trillion yen, PM says in Yomiuri interview | Reuters | 2026-08-28 | News | Japan FY27 debt-servicing cost projections, higher budget interest-rate assumption, and gross public debt above 200% of GDP. |
| 7 | Statement on currency operations (July 31, 2026) | Japan Ministry of Finance | 2026-08-03 | Government | U.S.-Japan coordinated intervention on July 31, 2026, including the dollar-funded-via-euros route and FIMA Repo context. |
| 8 | U.S. shakes up currency markets with talk of unusual yen-buying via selling euros | Reuters | 2026-08-03 | News | Mechanics of the U.S. side of the coordinated intervention and the rationale for routing through euros rather than direct dollar sales. |
| 9 | Japan spent record $96.5 billion to support yen over past month, ministry data shows | Reuters | 2026-08-28 | News | 15.4 trillion yen (~$96.5B) intervention spend between July 30 and August 26, 2026; USD/JPY returning near 160 by early September. |
| 10 | Foreign holdings of U.S. Treasuries fall in June, led by Japan, UK, China, data shows | Reuters | 2026-08-17 | News | Japan Treasury holdings at roughly $1.116 trillion at end-June 2026 and the June decline; cannot by itself prove FX-intervention selling. |
| 11 | Fed’s Warsh says past global savings glut is turning into an investment surge | Reuters | 2026-08-31 | News | Warsh Jackson Hole framing: shift from a savings glut toward an investment boom in governments, AI, energy, defense, and infrastructure. |
| 12 | BOJ to speed up its tightening campaign, raise key rate to 1.25% in September | Reuters | 2026-08-25 | News | Late-August Reuters economist poll: 57% expect a BOJ hike from 1% to 1.25% in September 2026, up from 5% a month earlier. |
| 13 | Global markets | Reuters | 2026-08-31 | News | Market-implied probability of a September Fed hike moving toward roughly two-thirds by the start of the month. |
| 14 | Yen hangs near 160 amid BOJ rate hike bets, dollar wobbles | Reuters | 2026-09-01 | News | USD/JPY near 160 with a firm dollar index, illustrating that a stronger yen does not require a weaker dollar. |
This article uses public reporting from Reuters, MarketWatch, the IMF, the U.S. Treasury, and the Japan Ministry of Finance to frame a macro thesis on the broken yen anchor, Japan’s yield curve, BOJ–Fed policy setup, and September cost-of-capital risk. Thesis-critical claims about the timing of the U.S.-Japan 10Y spread break, the IMF’s finding on term premium, and the U.S.–Japan coordinated intervention should be verified against the linked primary sources.
Related Reading

Could the Next U.S. Stock Market Selloff Begin With Japanese Banks?
Bank of America’s July 2026 Flow Show points to Japanese bank stocks as a possible early warning for global markets. The signal matters only when bond yields, capital flows, the yen, credit and U.S. market breadth begin deteriorating together.

America Is Rewriting Dollar Credibility
The U.S. is rebuilding dollar credibility through strong-dollar policy, Treasury demand, Fed uncertainty, stablecoins, AI infrastructure, and gold reserves.

Is the AI Bubble About to Break? The Real Risk May Be Hiding in the Credit System
AI demand is still growing, but as GPUs, long-term compute contracts, project finance, and customer credit become more tightly connected, the real risk may be hiding in how the expansion is funded.
Invest better with thoughtful research.
Join readers who receive our best ideas and insights straight to their inbox.
Disclosure
This article is for market research and risk-management purposes only and is not investment advice. Market prices and policy expectations are based on information available as of September 1, 2026 and can change quickly.
Comments