In a July 2026 edition of The Flow Show, Bank of America’s strategy team raised a warning that sounded unusually specific: the first visible crack in the next global risk-asset correction may appear in Japanese bank stocks before it appears in the S&P 500.
The warning arrived as investors were already confronting an uncomfortable market.
Bank of America’s May 2026 Global Fund Manager Survey showed that the net share of respondents overweight equities had jumped from 13% in April to 50%, the largest monthly increase in the survey’s history, while average cash holdings fell from 4.3% to 3.9%. According to FINRA’s May 2026 margin statistics, margin debt reached $1.416 trillion in May, up from $1.221 trillion only two months earlier.
Institutional portfolios were aggressively positioned. Leverage was rising. The major indexes remained supported by earnings growth and the expanding AI investment cycle.
Yet Berkshire Hathaway’s Q1 2026 filing showed that its insurance and other businesses held $373.5 billion in cash, cash equivalents and U.S. Treasury bills at the end of March 2026. That figure does not mean Warren Buffett had predicted an imminent crash. It does show that one of the market’s most price-disciplined investors was preserving extraordinary liquidity while many other investors were increasing exposure.
This is the contradiction defining the market.
Investors know valuations are demanding. They know AI companies must deliver enough future revenue and cash flow to justify today’s capital spending. They know long-term interest rates remain a threat to equity multiples. They can see that leverage would amplify any sudden decline.
But most investors are still reluctant to leave.
Selling too early could mean missing another leg of the rally. Staying fully invested could mean absorbing a severe drawdown if one of the assumptions supporting the market suddenly fails. Ordinary investors can see the risk, but they have no reliable way to determine when concern should become action.
That is why Bank of America’s Japanese-bank warning deserves attention.
The report covered fund flows for the week ended July 8, 2026 and was publicly summarized on July 10. Global equity funds had attracted another $56.6 billion during the week, while Bank of America’s Bull & Bear Indicator remained at 9.5, above the firm’s 8.0 sell-signal threshold.
Against this backdrop, Hartnett described Japanese bank stocks as a potential “canary in the coal mine” for global risk assets.
His argument was conditional. Japanese banks normally benefit when domestic interest rates rise because higher loan yields can improve net interest margins. If Japanese government bond yields continue climbing but bank shares begin falling, the market may be signaling that bond losses, funding pressure and tighter financial conditions are overtaking the earnings benefit from higher rates.
That reversal would not prove that a U.S. crash had begun. It could, however, reveal that Japan’s rate normalization was starting to alter global liquidity, foreign-bond demand and leveraged capital flows.
The value of the signal is therefore not that it predicts an exact market top.
It gives ordinary investors a place to look for evidence that an expensive but functioning market is beginning to become unstable.
The Four Assumptions Supporting the Market in July 2026
In the same July 2026 Flow Show summary, Hartnett argued that the market consensus was resting on four outcomes investors broadly expected not to occur:
- No hard landing for the U.S. economy
- No return to Federal Reserve rate hikes
- No reduction in AI capital expenditure
- No Democratic sweep in the 2026 midterm elections
These four assumptions support different parts of the market’s valuation.
The first protects corporate earnings. If employment, consumption and business investment slow without collapsing, investors can continue to price a soft landing and further profit growth. A recession becomes dangerous for equities when it causes analysts to cut revenue, margin and earnings expectations across a broad range of industries.
The second protects valuation multiples. High-growth companies are particularly sensitive to the interest rate used to discount future cash flows. If inflation forces the Federal Reserve to resume tightening, the market could face weaker economic growth and a higher discount rate at the same time.
The third protects the AI investment cycle. Current expectations for semiconductors, memory, networking, optical components, power infrastructure, cooling systems and data centers depend on Microsoft, Meta, Alphabet, Amazon and other large buyers continuing to expand capital spending.
The market is therefore betting on more than the continued existence of AI demand. It is betting that spending will keep increasing and that future revenue, free cash flow and returns on invested capital will eventually justify the scale of that investment.
The fourth assumption concerns policy. The outcome of the 2026 midterm elections could affect expectations for taxes, regulation, fiscal spending and Treasury issuance. Hartnett’s framework identifies this as a market assumption embedded in July 2026 asset prices, not as a forecast of the election result.
None of these four assumptions had been decisively disproved when the report was published. That helps explain why investors can feel nervous while remaining heavily invested.
An expensive market does not fall merely because investors recognize that it is expensive. It normally needs a catalyst that changes earnings expectations, discount rates, liquidity or positioning.
Why Is Bank of America Watching Japanese Banks?
For much of Japan’s recent normalization cycle, rising interest rates have been supportive of bank earnings.
Japan spent decades under zero and negative interest rates. Loan yields remained low, net interest margins were compressed and banks struggled to earn attractive returns from conventional lending. As the Bank of Japan moved away from ultra-low rates, banks gained the ability to earn more on loans and financial assets.
The normal relationship is therefore intuitive:
Higher Japanese rates → wider lending margins → stronger earnings expectations → stronger bank shares.
The benefit has limits.
The Bank of Japan’s April 2026 Financial System Report stated that valuation losses on securities holdings—particularly yen-denominated bonds—had worsened as interest rates rose. The report also emphasized that banks had reduced yen-bond exposure and shortened portfolio duration, leaving the system with sufficient loss-absorbing capacity overall.
Both parts of that finding matter.
Higher rates are creating mark-to-market pressure, but the Bank of Japan was not describing an existing banking crisis. Japanese banks, as a group, still had sufficient capital and had already taken steps to reduce duration risk.
That makes bank-stock behavior useful as a market signal. It can reveal when investors begin to believe that bond losses, funding costs and tighter financial conditions are overtaking the earnings benefit from wider margins.
A sector expected to benefit from higher rates may therefore become useful precisely when it stops behaving as expected.
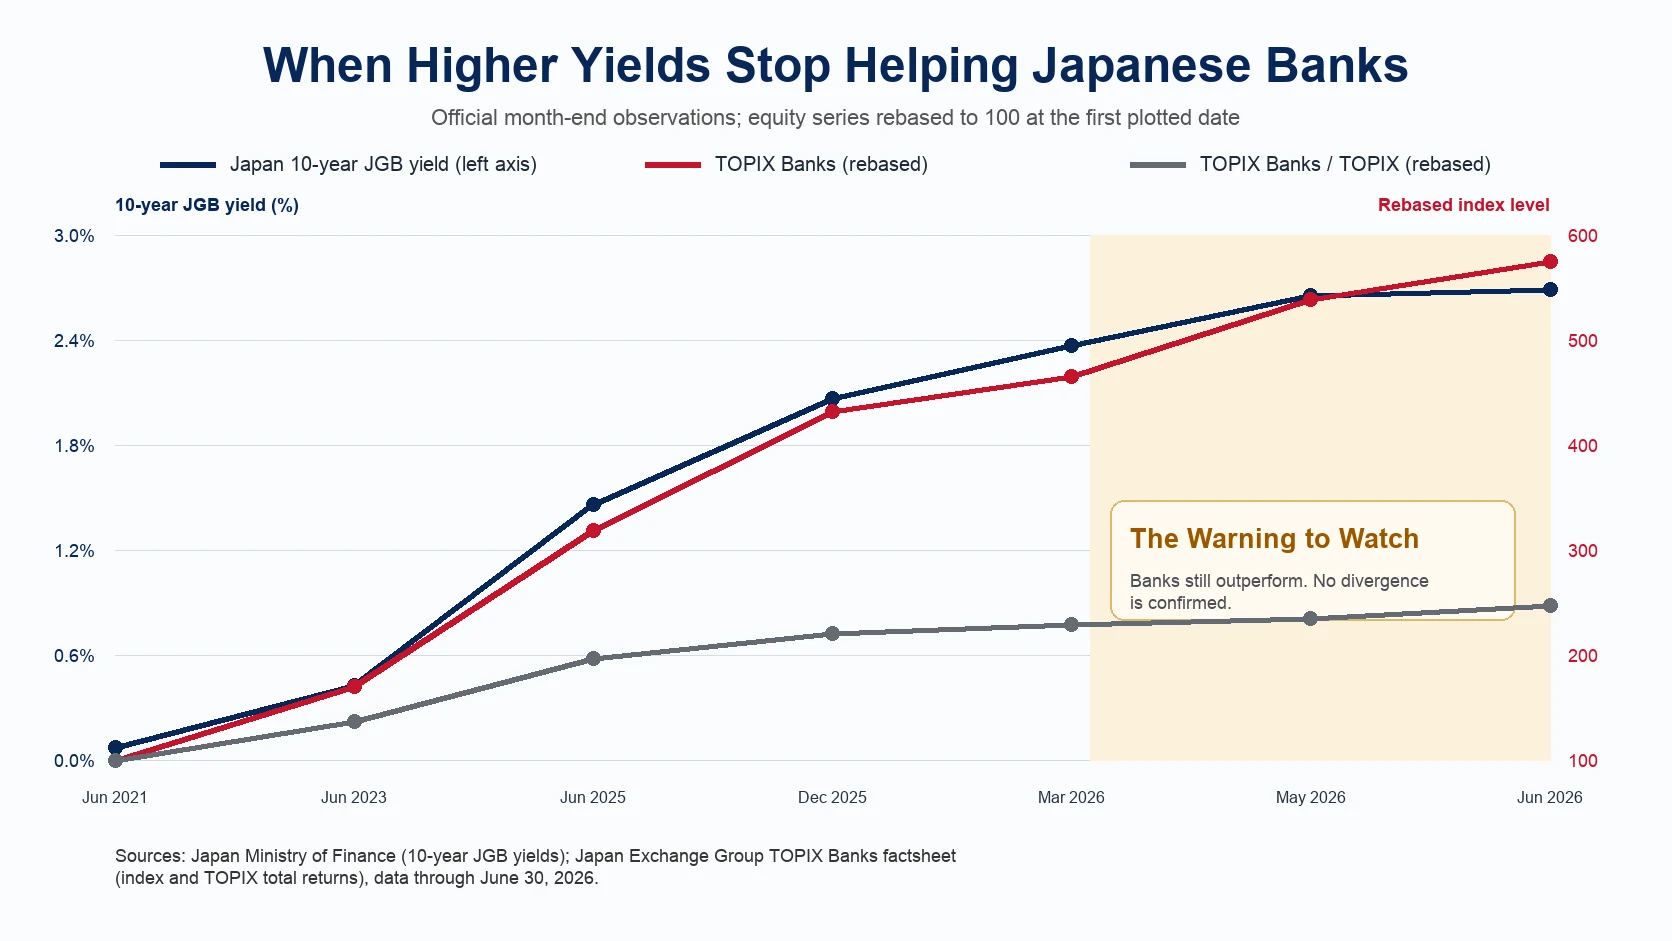
The warning is not that Japanese bank shares experience an ordinary down day. The more meaningful condition would be a sustained divergence:
Japanese long-term yields continue rising while Japanese banks begin underperforming the broader Japanese market.
That would suggest the market is starting to price higher rates as a constraint rather than a profit opportunity.
How Could Stress in Japan Reach Wall Street?
A decline in Japanese bank stocks would not directly cause the S&P 500 to fall. Its importance depends on whether the underlying pressure begins moving through capital flows, currencies and funding markets.
Japan has long been one of the world’s largest exporters of capital. Domestic banks, insurers, pension funds and asset managers accumulated foreign bonds and other overseas assets partly because Japanese yields remained extremely low.
Japan’s Ministry of Finance securities-flow data tracks residents’ purchases and sales of foreign equities, long-term debt and short-term debt each week. Those releases allow investors to test whether talk of capital repatriation is turning into an observable trend.
If Japanese yields rise enough to make domestic bonds more attractive, or if currency-hedging costs reduce the return available from U.S. debt, Japanese institutions may slow foreign-bond purchases or become sustained net sellers.
The first U.S. effect would likely appear in the Treasury market. Reduced structural demand could keep long-term yields higher than they would otherwise be, even while equity investors become more risk-averse.
The second channel runs through the yen carry trade.
For years, investors could borrow at low rates in yen and use the proceeds to buy higher-returning assets abroad. A rapid appreciation of the yen raises the cost of maintaining those positions and can force leveraged investors to reduce exposure.
A stronger yen alone does not prove that deleveraging is occurring. The signal becomes more meaningful when a sharp yen rally is accompanied by higher currency volatility, weaker equities, widening credit spreads and declining leveraged exposure.
The third channel involves the interaction between Treasury markets and non-bank leverage.
The Federal Reserve’s May 2026 Financial Stability Report continued to identify elevated hedge-fund leverage and concentrated exposures as vulnerabilities capable of amplifying shocks across markets. If long-term Treasury yields rise while funding conditions tighten, leveraged funds may have to reduce positions in bonds, derivatives and equities at the same time.
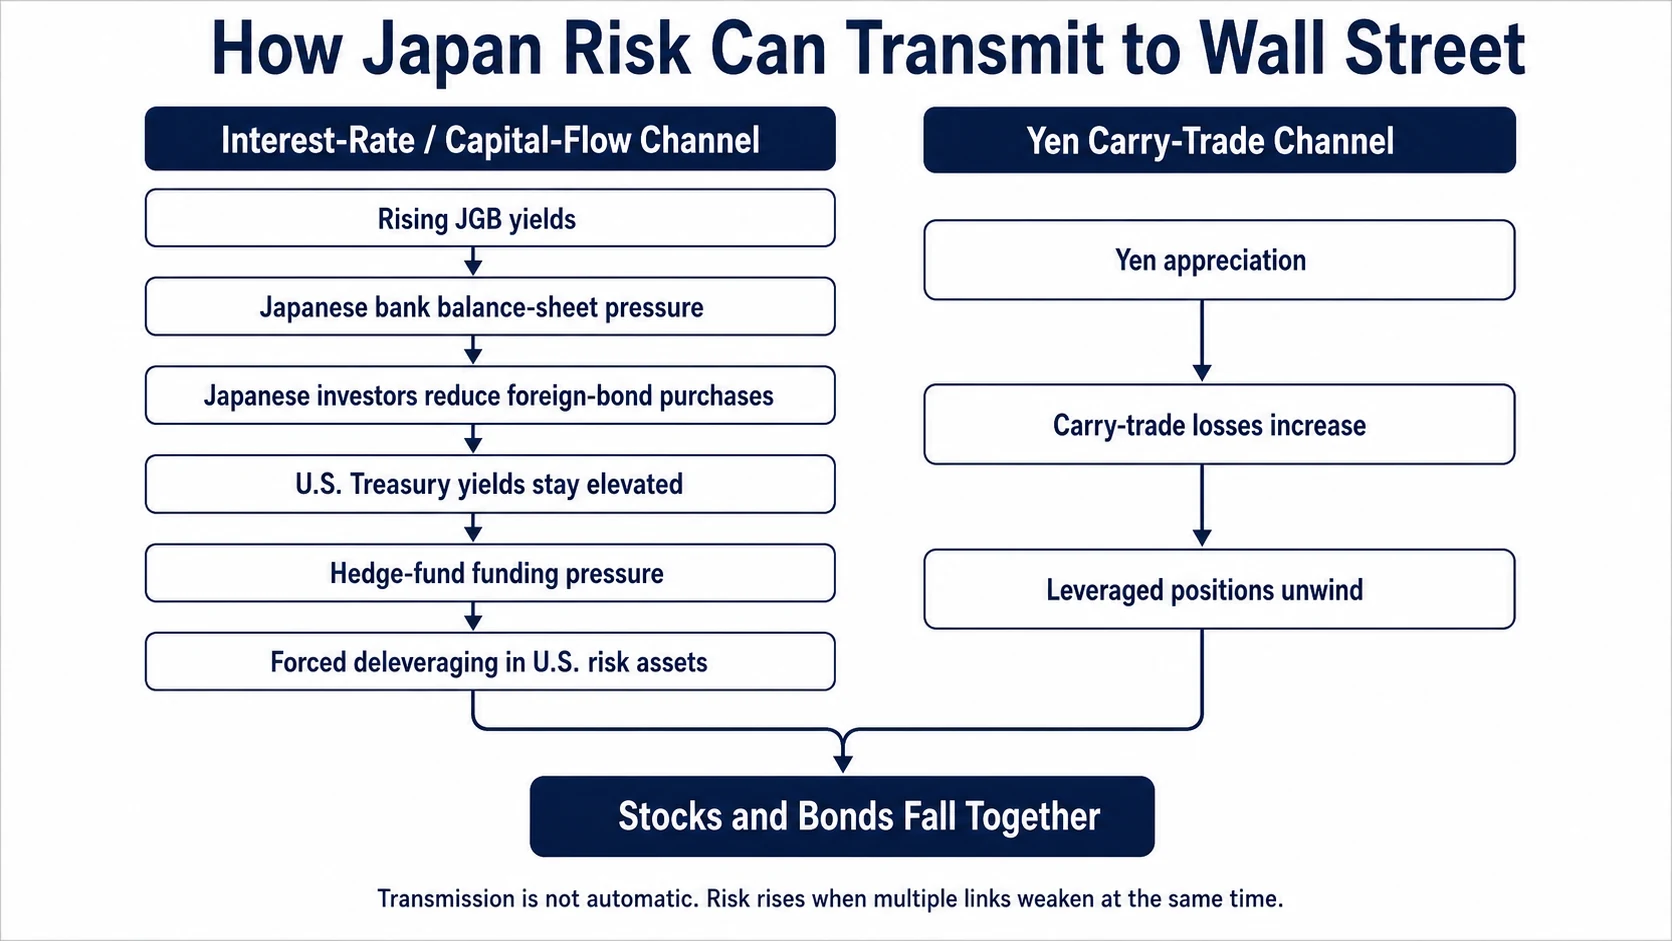
For U.S. investors, the most dangerous outcome would not be the conventional pattern of stocks falling while Treasury prices rise.
Government bonds normally cushion an equity decline caused by weaker growth. A more destabilizing liquidity event occurs when stocks and long-duration government bonds fall together. Investors then face weaker risk appetite and a higher discount rate at the same time.
Why High Positioning Can Amplify the Shock
High positioning does not create a crash by itself.
Equity exposure and margin debt often rise during bull markets because portfolio values, investor confidence and borrowing capacity rise together. Those indicators can remain elevated for months or years.
What positioning changes is the market’s response after a genuine catalyst appears.
When investors hold substantial cash, lower prices can attract new buying. When institutions, retail investors and leveraged funds are already heavily exposed, a decline is more likely to trigger margin calls, risk-limit reductions, redemptions and systematic selling.
That is why the FINRA margin figure matters without functioning as a precise sell signal. It measures the size of a potential amplifier, not the timing of the spark.
The same distinction applies to sentiment indicators. Bank of America’s Bull & Bear Indicator was already issuing a sell signal when Hartnett published the July report, but the historical record cited in the public summary showed average declines of only a few percentage points and a hit rate well below certainty.
A crowded market can continue rising. The risk becomes more serious when crowded positioning meets a deterioration in earnings, funding or liquidity.
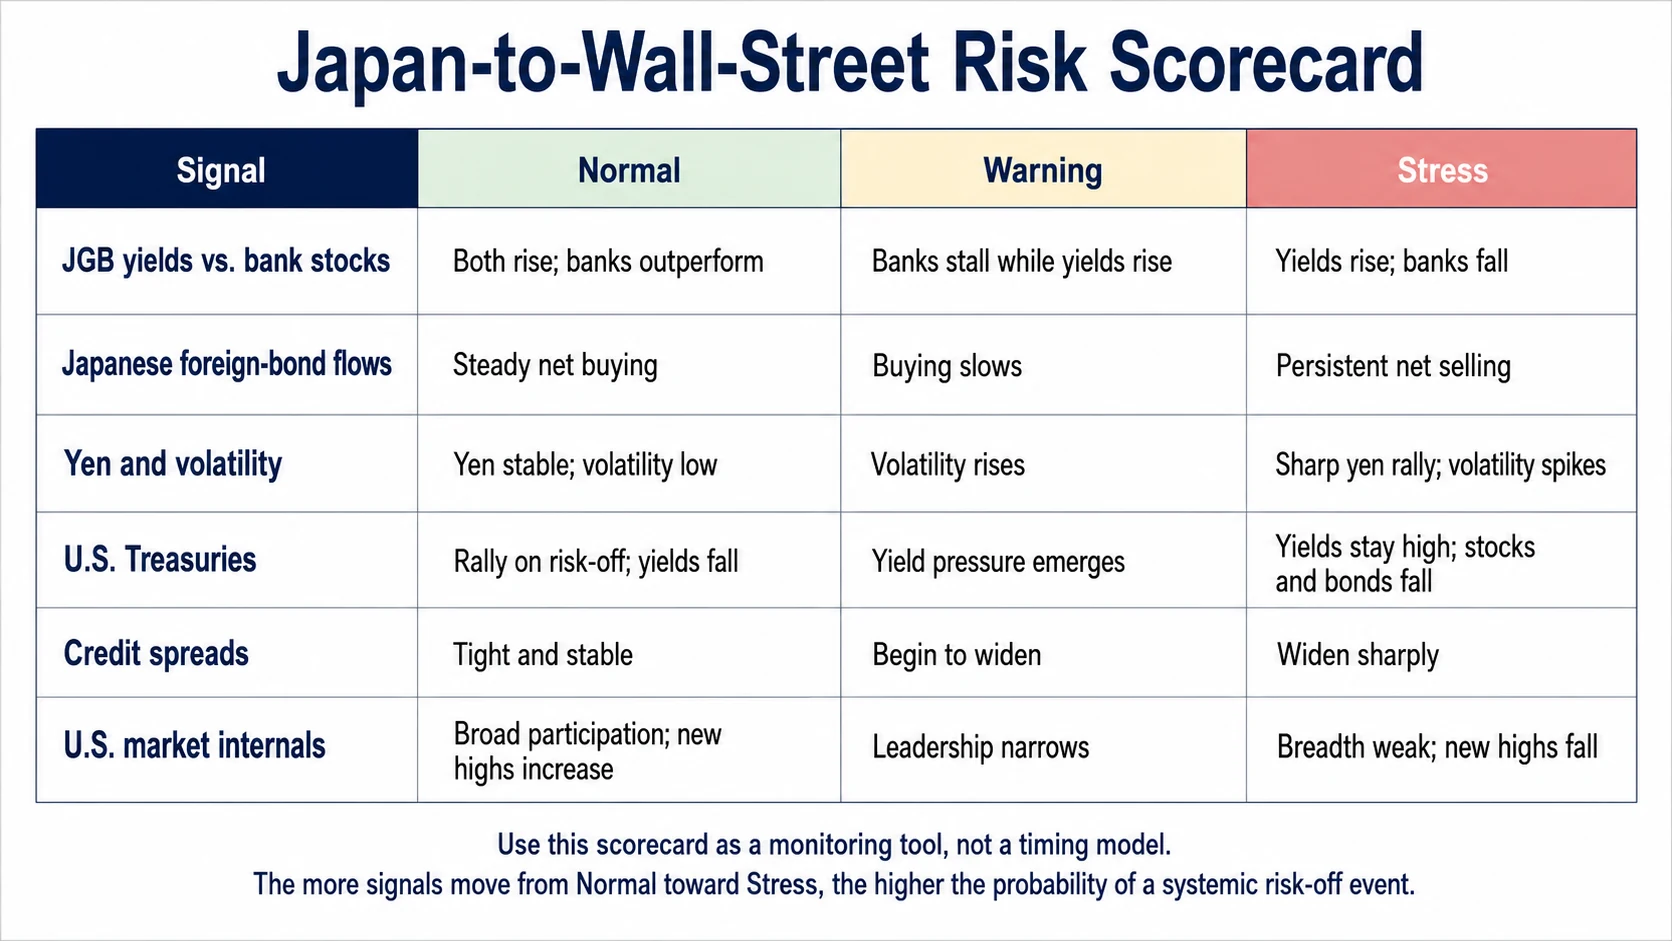
How Can Ordinary Investors Judge Whether a Crisis Is Beginning?
Ordinary investors cannot reproduce every model used by a global macro fund. They can still avoid the two most common errors: treating every warning as a reason to liquidate, or waiting until a recession and bear market are already obvious.
A better approach is to monitor the progression of stress in layers.
One isolated warning may justify closer monitoring. Deterioration across several layers may justify reducing leverage, raising liquidity or tightening position sizes, rather than automatically liquidating an entire portfolio.
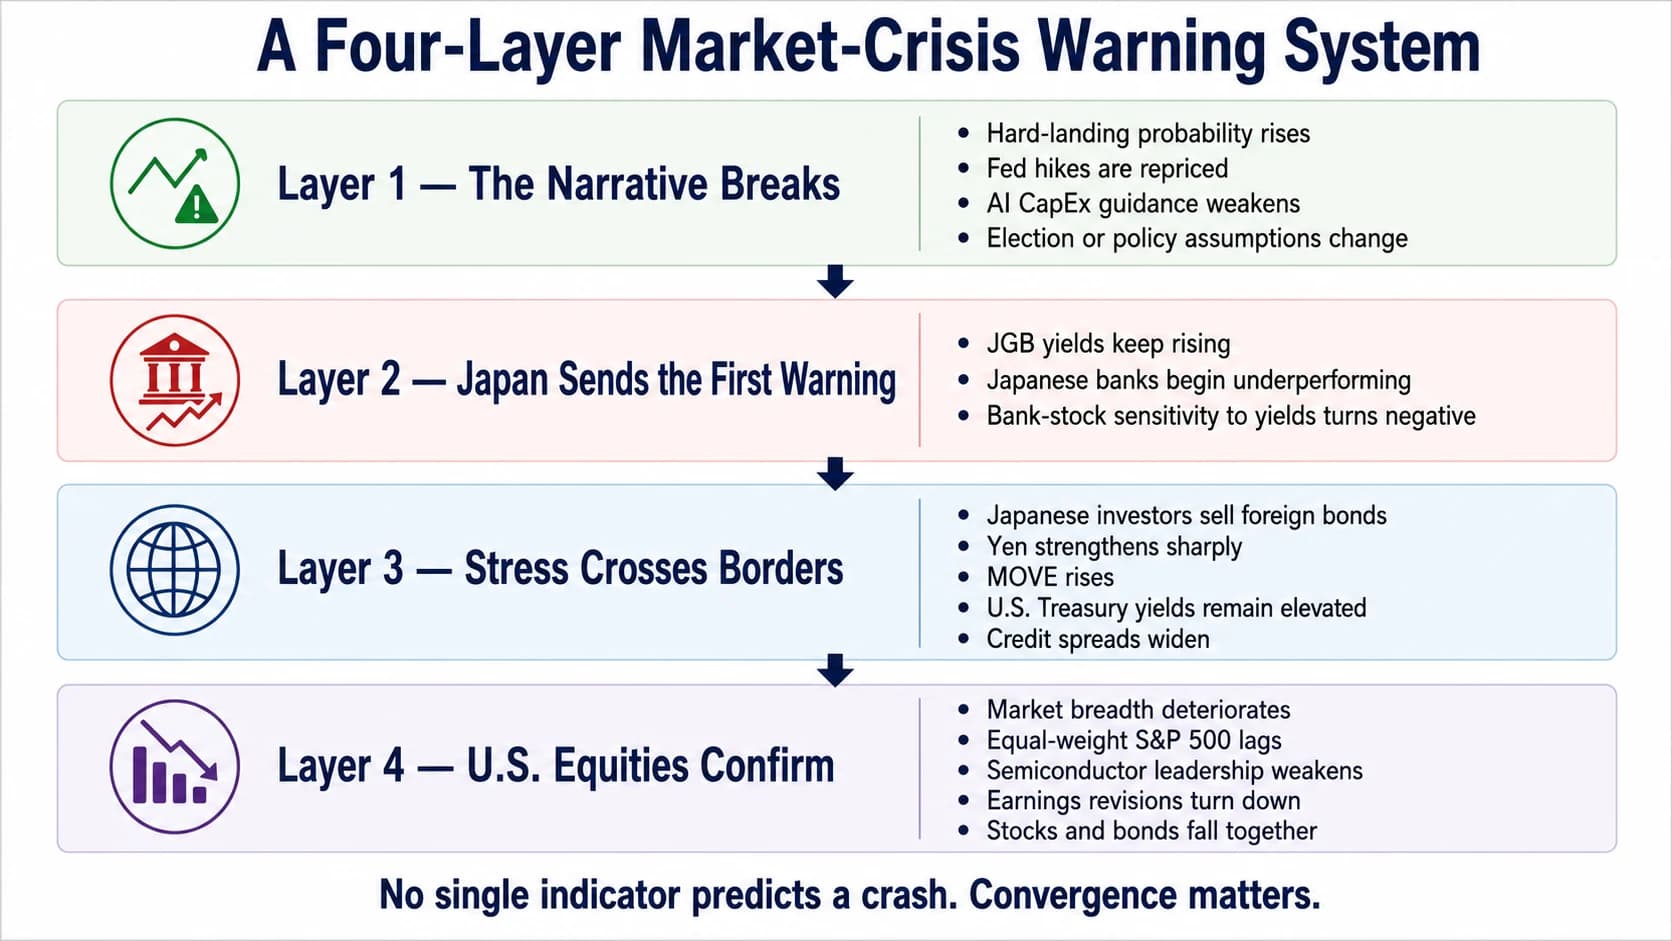
The narrative begins to break
Start with the four assumptions identified by Hartnett.
A broad deterioration in employment, consumption and earnings expectations would weaken the no-hard-landing assumption.
A renewed rise in inflation expectations and market pricing for additional Federal Reserve tightening would challenge the no-rate-hike assumption.
Lower capital-spending guidance from large cloud and technology companies, or evidence that AI revenue is failing to justify investment levels, would challenge the AI CapEx assumption.
Changes in fiscal, tax and regulatory expectations would challenge the political assumption.
One assumption breaking can produce a correction. Several breaking together would create a more serious earnings and valuation problem.
Japan sends the first market warning
Watch the relationship between Japanese government bond yields, the TOPIX Banks Index and the broader TOPIX.
If yields and bank shares rise together, the market still sees normalization as beneficial.
If yields keep climbing while Japanese bank shares lose relative strength over several weeks, investors may be shifting their focus from margin expansion to bond losses and tightening financial conditions.
The duration and relative performance matter more than a single trading session.
Stress crosses borders
Next, monitor whether Japan’s pressure is moving into global markets:
- Japanese residents’ four-week purchases or sales of foreign long-term debt
- USD/JPY and yen implied volatility
- U.S. 10-year and 30-year Treasury yields
- The MOVE bond-volatility index
- U.S. high-yield credit spreads
The warning becomes more credible when Japanese investors sell foreign bonds, the yen strengthens sharply, Treasury yields remain elevated and credit spreads widen together.
U.S. markets confirm the deterioration
Finally, look beneath the S&P 500 headline level.
Useful confirmation indicators include:
- The percentage of S&P 500 stocks above their 50-day and 200-day moving averages
- Equal-weighted S&P 500 performance relative to the capitalization-weighted index
- Semiconductor performance relative to the S&P 500
- The number of stocks making new highs
- The breadth of positive earnings revisions
- High-yield credit spreads
An index can remain near a record while participation narrows and credit conditions deteriorate. That internal divergence often provides more information than the index level alone.
The Real Danger Is Not Valuation Alone
The U.S. market does not have to fall simply because valuation is elevated.
When Hartnett published the July 2026 report, the four assumptions supporting the market had not yet been disproved. The economy had not suffered a hard landing, the Federal Reserve had not resumed hiking, AI capital expenditure had not been broadly cut and the election result remained unknown.
Those conditions could continue to support earnings and equity prices.
The risk is that the market has less room for error. Margin borrowing is high, institutional exposure is elevated and leverage can amplify a shock once selling begins.
Japanese bank stocks should therefore be treated as one component of a larger monitoring system, not as a mechanical sell signal.
The most serious warning would involve convergence:
Japanese yields rise rapidly while Japanese banks underperform; Japanese investors become sustained sellers of foreign bonds; the yen rallies as leveraged trades unwind; U.S. Treasuries fail to rally during an equity decline; credit spreads widen; U.S. market breadth deteriorates; and at least one of Hartnett’s four assumptions is being disproved.
At that point, investors would be facing more than an expensive market.
They would be facing a simultaneous shift in funding costs, leverage, capital flows and earnings expectations.
The next major U.S. selloff may not be caused by Japan. But for investors trying to recognize financial stress before it becomes obvious in the S&P 500, Japanese bank stocks may provide one of the earliest visible cracks.
Sources
| No. | Source | Publisher | Date | Type | What it supports |
|---|---|---|---|---|---|
| 1 | Public media summary of BofA Global Research's The Flow Show, led by Michael Hartnett | Futu News | 2026-07-10 | News | Four no assumptions, Bull & Bear Indicator, and Japanese banks as the canary; report covered the week ended July 8. |
| 2 | Margin Statistics | FINRA | 2026-05 | Official | Customer securities-margin debit balances. |
| 3 | First Quarter 2026 Form 10-Q | Berkshire Hathaway | 2026-03-31 | Company filing | Cash, Treasury bills and liquidity context. |
| 4 | Financial System Report — April 2026 | Bank of Japan | 2026-04-21 | Central bank | Bond valuation losses, duration reduction and bank resilience. |
| 5 | International Transactions in Securities | Japan Ministry of Finance | Weekly data | Government | Japanese purchases and sales of foreign securities. |
| 6 | Financial Stability Report — May 2026 | Federal Reserve | 2026-05-08 | Central bank | Hedge-fund leverage and cross-market amplification risk. |
| 7 | Global fund managers boost equity allocations by record in May, BofA survey shows | Reuters via MarketScreener | 2026-05-19 | News | May 2026 Global Fund Manager Survey equity allocation and average cash holdings. |
| 8 | JGB Interest Rate Historical Data | Japan Ministry of Finance | Through 2026-06-30 | Government data | Official 10-year JGB observations used in the rebuilt chart. |
| 9 | TOPIX Banks Factsheet | Japan Exchange Group | 2026-06-30 | Exchange data | TOPIX Banks and TOPIX total-return observations used in the rebuilt chart. |
Source note: Bank of America’s complete institutional Flow Show report was not publicly accessible. References to Michael Hartnett’s July 2026 view are based on a dated public media summary. The transmission analysis, four-layer warning framework and risk scorecard are VIUS research.
Related Reading

Can AI CapEx Pay Off? Start With Token Cost, Then Watch the Payback Period.
Nvidia is showing that the unit cost of AI production is falling. Investors are asking whether cheaper tokens can turn into visible profits and free cash flow fast enough.

The U.S. Economy and U.S. Fiscal System Are Demanding Opposite Monetary Policies
What broke on June 5 was not AI valuation, but the market’s faith in endless Quantitative Easing

How to Read the AI Cycle: CapEx, Supply Bottlenecks, and the Semiconductor Trade
AI infrastructure spending is still expanding, but the semiconductor equity trade is becoming more fragile. The next phase depends on CapEx, supply bottlenecks, usage, pricing, and earnings revisions.
Invest better with thoughtful research.
Join readers who receive our best ideas and insights straight to their inbox.
Disclosure
This article is for research and education only. It is not investment advice.
Comments