AI infrastructure spending is still expanding, but the equity trade around semiconductors is becoming more fragile. The next phase of the market may depend less on whether AI demand exists, and more on where the next earnings revision can still come from.
The AI debate has moved into a more difficult phase. The first stage was simple: cloud companies were spending aggressively, Nvidia was supply constrained, and every earnings call seemed to confirm that AI infrastructure was the dominant capital cycle in the market. The harder question now is whether this spending wave is producing enough usage, revenue, and pricing power to justify the capital already committed.
That question cannot be answered by looking at hyperscaler CapEx alone. Quarterly capital spending tells investors where money has already been committed, but it arrives with a reporting lag and is often smoothed through management commentary. Supply-chain data gives an earlier read on physical constraints, but it can also reflect pre-orders, capacity hoarding, and fear of shortage. Usage data is closer to real demand, but it is noisy unless it can be tied to paid consumption or cloud revenue. The AI cycle has to be read across all three layers.
The current evidence still points to an infrastructure cycle that is expanding rather than contracting. What has changed is the equity market's tolerance for the most crowded part of that cycle. Semiconductor stocks can begin to lose leadership before AI spending itself rolls over, especially when earnings revision breadth and price momentum are already stretched.
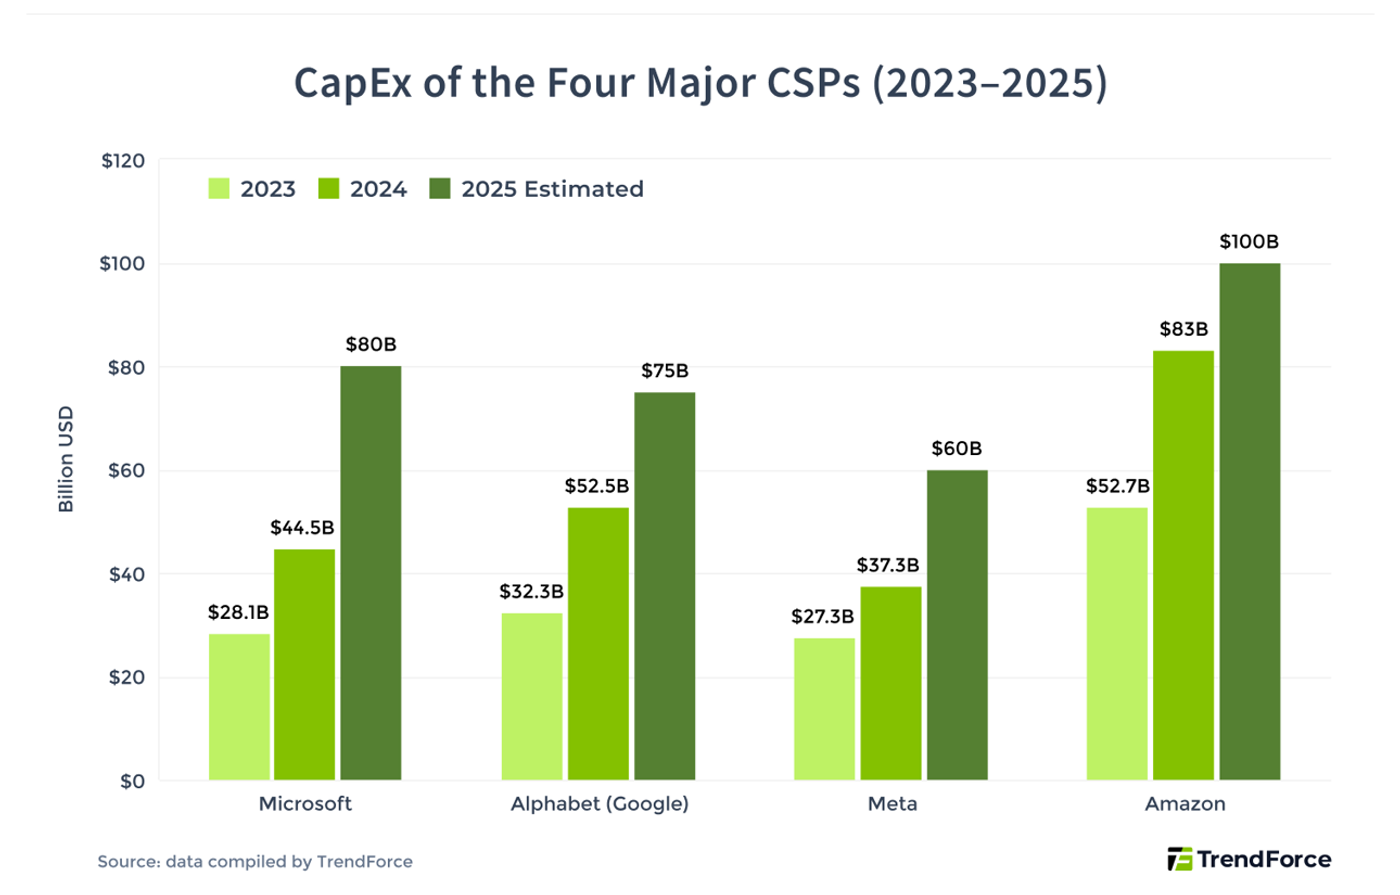
The starting point remains capital intensity. Goldman Sachs has highlighted that hyperscaler spending is still rising sharply, with reported estimates around $757 billion for 2026 and $920 billion for 2027. Other market estimates differ by definition and company set, but the direction is consistent: the largest buyers of compute have not yet shifted from expansion to retrenchment.
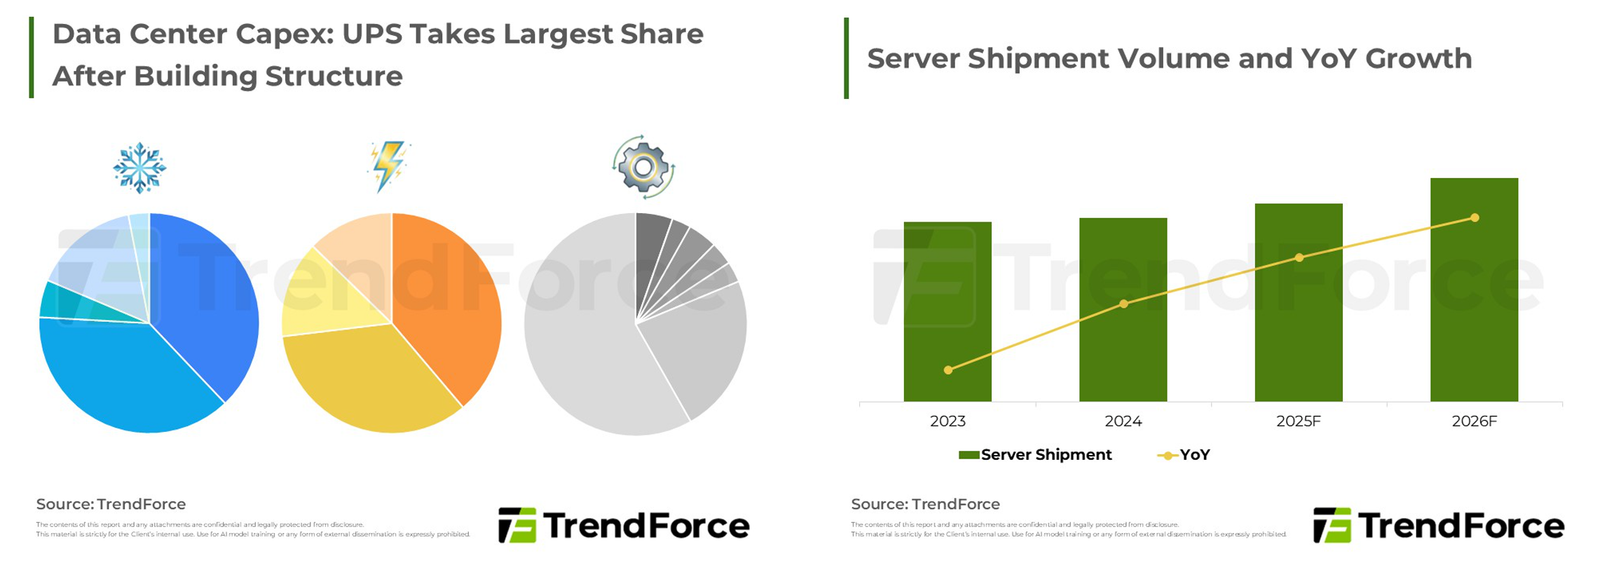
The reason CapEx remains high is visible in the physical layer of the supply chain. AI compute is constrained by advanced packaging, high-bandwidth memory, power delivery, and server integration. TSMC CoWoS capacity, HBM allocation, networking systems, and data-center power availability are not clean substitutes for hyperscaler CapEx, but they reveal the physical boundary of the cycle. If demand were already weakening, the market would expect to see shorter lead times, weaker allocation pressure, or less willingness to lock capacity in advance. Instead, the supply chain still looks like a system trying to catch up with demand.
The physical AI buildout is not only GPUs. TrendForce's data-center CapEx and server shipment charts show that power systems, cooling, rack-level infrastructure, and server volumes are all part of the same capital cycle. AI demand has to pass through physical systems before it appears as revenue, which is why these supply-chain charts matter alongside hyperscaler CapEx.
The next layer is pricing. In a normal capital cycle, the earliest warning often appears when capacity continues to expand while prices stop responding. AI compute has not yet shown that kind of broad deflationary break. Recent reporting says AWS is raising prices for EC2 Capacity Blocks for Machine Learning, with the company pointing to supply-demand dynamics. That is a narrow product category, and it should not be treated as a complete market index, but it is still consistent with a market where high-end compute remains scarce rather than abundant.
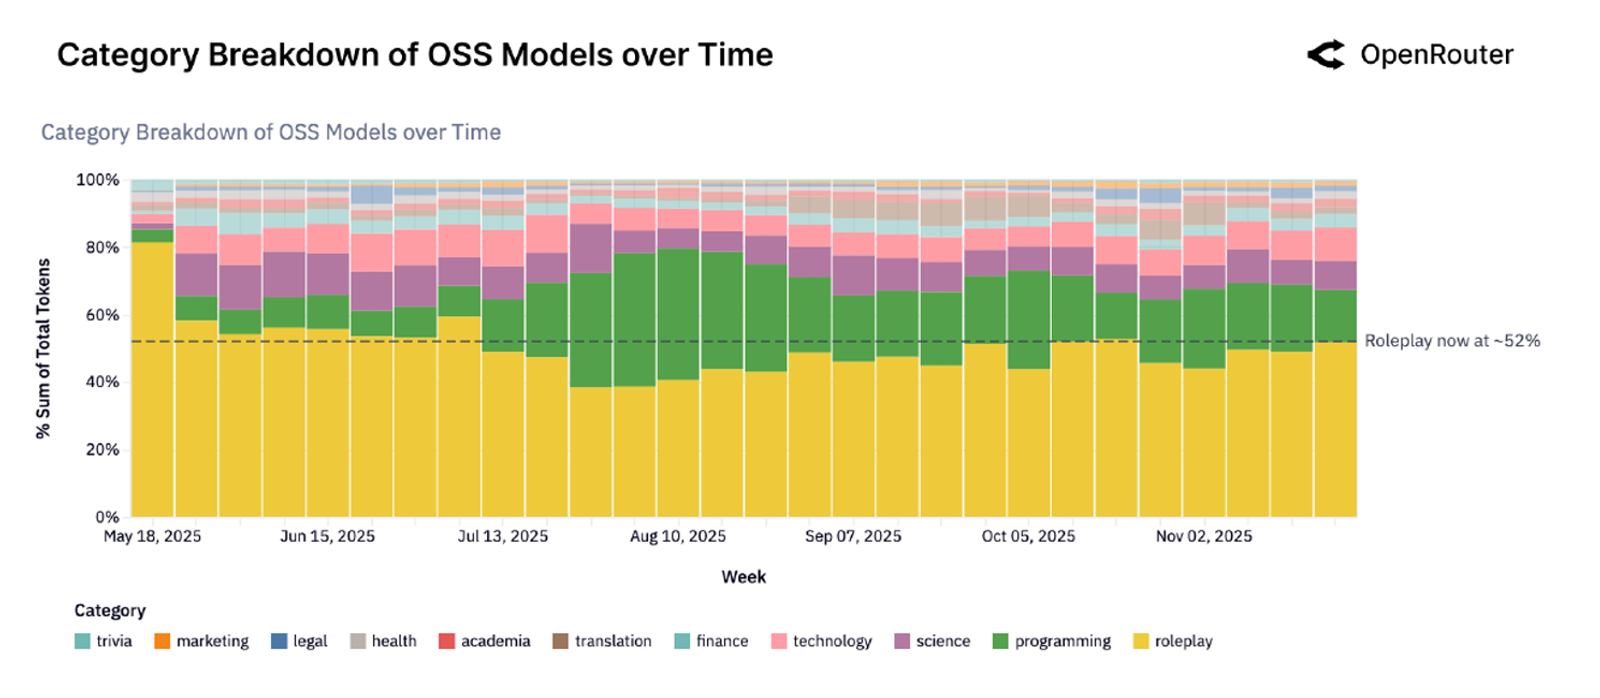
The stronger test is usage. Spending can be speculative, and supply constraints can be exaggerated by pre-ordering, but production usage is harder to fake over time. OpenRouter's public data and its empirical token study provide a useful, imperfect window into real-world LLM usage. The paper analyzed more than 100 trillion tokens of LLM interactions across tasks, models, geographies, and time. This is not the same as paid enterprise demand, but it helps show that inference activity is no longer confined to laboratory testing.
Usage becomes economically relevant only when it begins to appear in revenue, backlog, or pricing power. Microsoft, Alphabet, Amazon, and Meta all remain important tests because their AI infrastructure spending must eventually be absorbed by cloud revenue, enterprise AI products, advertising tools, consumer AI products, and platform usage. The evidence still does not isolate AI return on invested capital with precision, but the cloud revenue and backlog data reduce the plausibility of a simple "spending without demand" narrative.
The result is a cycle that has moved beyond the earliest hardware-shortage phase but has not yet entered a clear overcapacity phase. Capital is still being committed, bottlenecks still matter, usage is expanding, and at least part of the demand is becoming visible in cloud revenue. The weak point is less about whether AI demand exists, and more about whether the most obvious beneficiaries can still deliver enough incremental revisions to justify their valuations.
That distinction is essential for interpreting Morgan Stanley's latest warning on semiconductor stocks. Mike Wilson's argument is not that AI demand has disappeared. His warning is that semiconductor equities have become a crowded momentum trade at a point when earnings revision breadth is pressing against historical extremes. MarketWatch's summary of the report noted that Wilson compared semiconductor stocks with silver stocks earlier this year, arguing that the semis' momentum pattern may be approaching a similar climax after a powerful run. It also cited the SOX Index's sharp two-week swing, with a 7.3% weekly gain followed by a 7.9% decline.
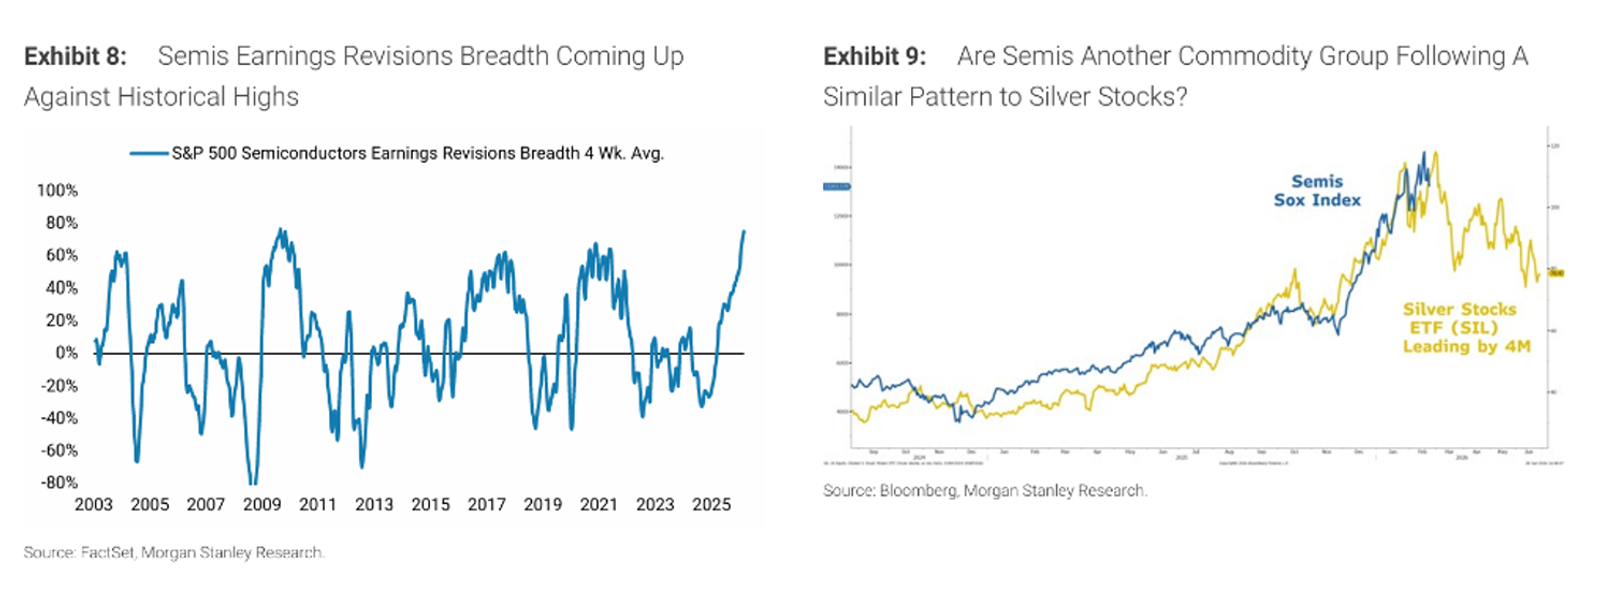
The Morgan Stanley revision-breadth warning is more important than the silver analogy. It says semiconductor earnings revisions are approaching levels that have historically been difficult to sustain. Stocks are priced on the next revision, not the absolute size of the end market. When a sector already reflects broad upward revisions, the bar for further upside rises even if the underlying industry remains healthy.
The silver comparison is useful as a market-structure warning, not as a fundamental forecast. Commodity-like momentum trades often look strongest near the point when incremental buyers are most crowded. Semiconductors have behaved like the most liquid expression of AI CapEx. That makes them vulnerable to leadership fatigue if investors begin to rotate from obvious CapEx beneficiaries into areas where earnings are improving from a lower base.
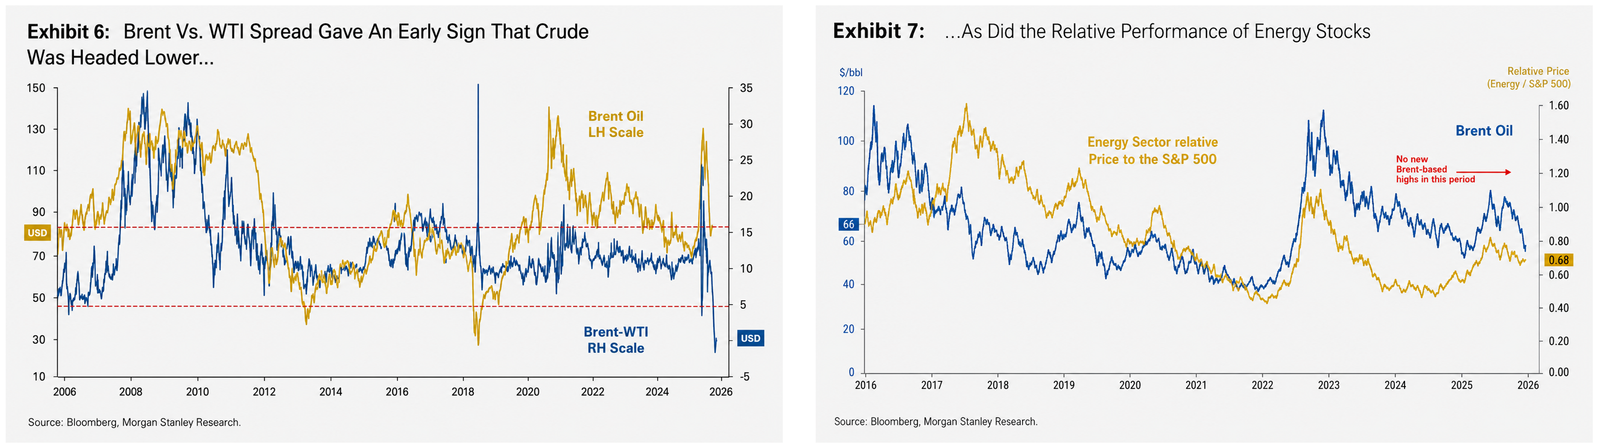
Wilson's framework is not limited to semiconductors. The oil-market analogy is not that semiconductors are oil, but that secondary market signals can weaken before the underlying cycle is universally recognized as late.
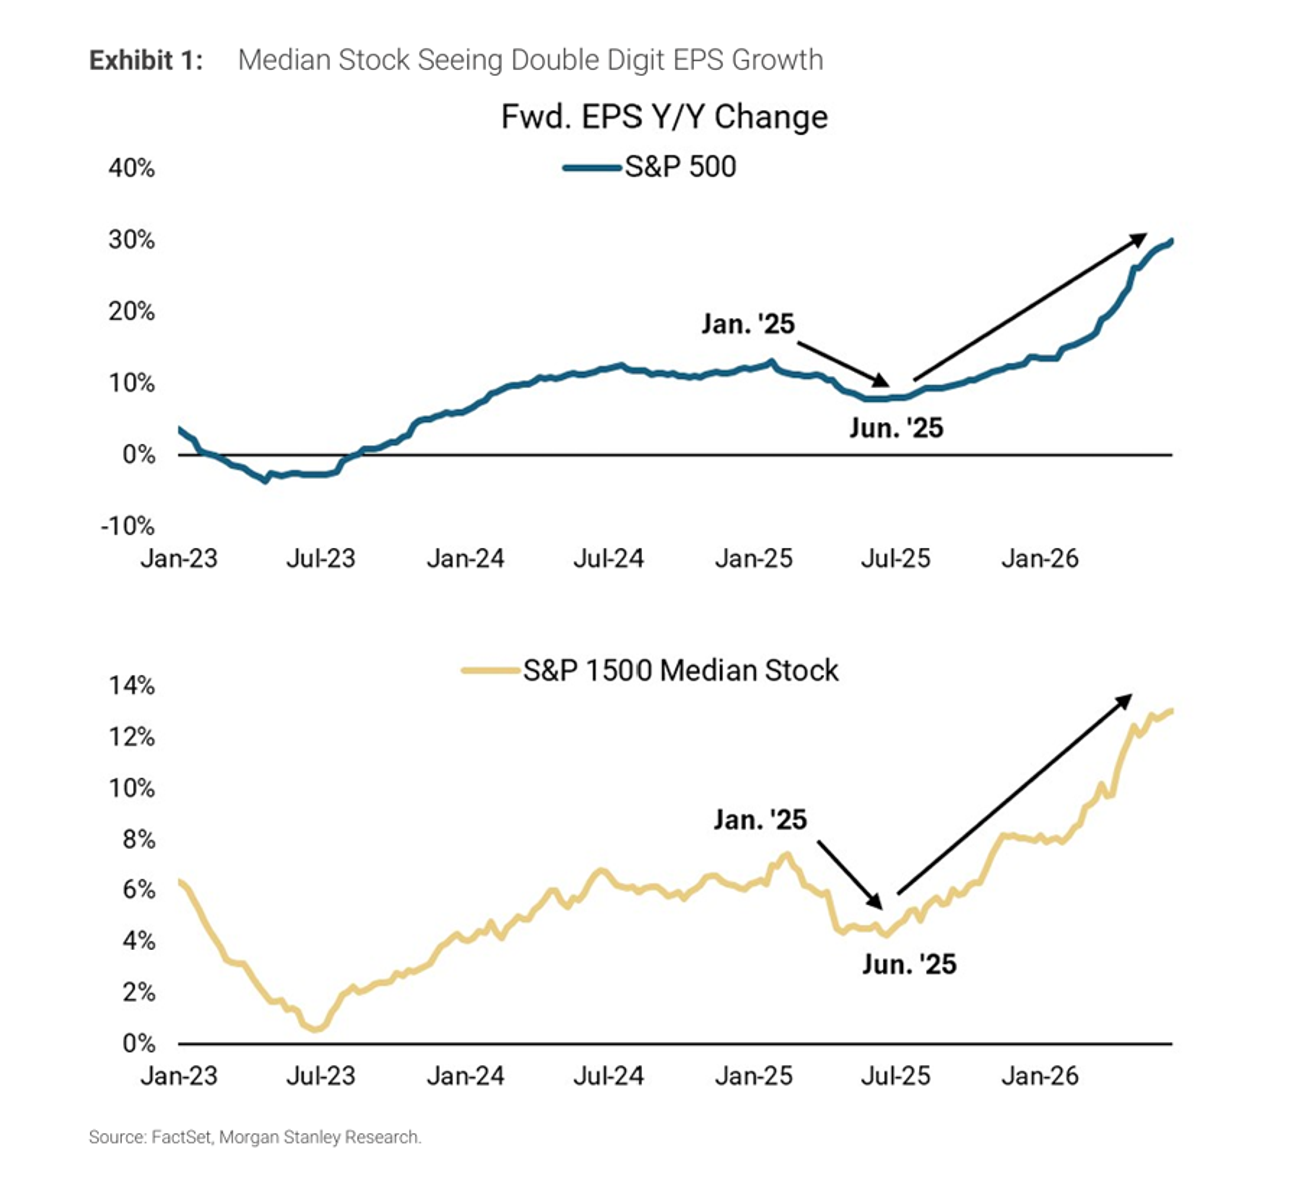
This is where the broader market evidence matters. Morgan Stanley's chart on forward EPS growth shows both the S&P 500 and the S&P 1500 median stock improving from the June 2025 trough, with the median stock moving into double-digit EPS growth. The significance is not that AI is losing relevance. It is that earnings growth is no longer confined to the narrow AI complex. When the median company's earnings begin to recover, equity leadership can broaden even while AI infrastructure spending remains elevated.
That broadening creates a different market regime. In the first phase of the AI trade, the market rewarded companies closest to the infrastructure bottleneck: GPUs, HBM, advanced packaging, networking, power equipment, and data-center capacity. In the next phase, investors are likely to ask whether those companies still have room for positive revisions after a major rerating. At the same time, they may become more willing to pay for sectors where earnings have improved but positioning remains lighter.
The core conclusion is that the AI industrial cycle and the semiconductor equity trade are no longer the same thing. AI infrastructure can continue to expand while semiconductor stocks enter a period of relative underperformance. That would not be a contradiction. It would be a normal transition from a shortage-driven trade to a revision-driven market.
A real AI cycle downturn would require a different evidence set. It would show up through CapEx guidance cuts, easing CoWoS and HBM constraints, falling high-end compute prices, weaker paid usage, and cloud revenue failing to absorb the new capacity. Those signals are not yet aligned. The clearer signal today is narrower: the most crowded semiconductor trade has less margin for error, while the broader market is showing signs of earnings recovery.
The practical reading is therefore more nuanced than either the bulls or the skeptics usually allow. AI infrastructure remains in a mid-cycle expansion and commercialization phase. Semiconductor equities, however, are moving into a more fragile part of their trading cycle, where further gains require fresh earnings revisions rather than another confirmation that AI spending is large. For investors, the question is shifting from whether AI spending continues to where the next incremental revision still exists.
Sources & Notes
Sources for this article are listed below. Morgan Stanley chart images are used as supplied image evidence with the source lines shown in the charts; market-reported figures should be treated as reported estimates, not audited company disclosures.
Used for Goldman Sachs' reported hyperscaler CapEx estimates of roughly $757 billion in 2026 and $920 billion in 2027.
Used for cloud CapEx, Microsoft and Alphabet CapEx guidance, Google Cloud revenue, and backlog context.
Used for RBC and TrendForce-referenced memory price pressure and the interpretation of Big Tech CapEx growth.
Used for public TrendForce charts on major CSP CapEx, AI data-center CapEx composition, and server shipment growth.
Used for AWS EC2 Capacity Blocks for ML price increases and the supply-demand framing around scarce GPU capacity.
Used for OpenRouter-based evidence of real-world LLM usage across more than 100 trillion tokens.
Used for Morgan Stanley's warning on semiconductor momentum, earnings revision breadth, and market broadening.
- Morgan Stanley Exhibit 1: Median Stock Seeing Double Digit EPS Growth
Source line shown in supplied chart image; used for forward EPS growth and market-broadening discussion.
- Morgan Stanley Exhibit 6: Brent vs. WTI Spread Gave an Early Sign That Crude Was Headed Lower
Source line shown in supplied chart image; used as a historical analogy for reading cycle signals before headline prices fully move.
- Morgan Stanley Exhibit 7: Relative Performance of Energy Stocks
Source line shown in supplied chart image; used as a historical analogy for equity leadership weakening before the underlying commodity cycle fully ends.
- Morgan Stanley Exhibits 8 and 9: Semiconductor Revision Breadth and Silver Analogy
Source lines shown in supplied chart image; used for semiconductor earnings-revision breadth and momentum analogy.
FAQ
Is the AI infrastructure cycle already rolling over?
The evidence in this article does not show a clear AI infrastructure downturn. CapEx, supply bottlenecks, usage, and cloud revenue still point to expansion, but semiconductor equities have less room for disappointment.
Why can semiconductor stocks weaken if AI spending is still rising?
Stocks discount incremental revisions, positioning, and future expectations. When earnings revision breadth is already stretched, semiconductors can underperform even while the AI buildout remains healthy.
What signals would mark a real AI cycle downturn?
A real downturn would require aligned evidence: CapEx guidance cuts, easing CoWoS and HBM constraints, falling high-end compute prices, weaker paid usage, and cloud revenue failing to absorb new capacity.
Disclosure
This article is for educational and informational purposes only. It does not constitute investment advice, a recommendation, or a solicitation to buy or sell any security.